What Is an Audiogram?
The results of your hearing test are shown on a graph called an audiogram. This graph shows which types of sounds you can and can’t hear. Hearing aids are prescribed based on the results of your audiogram. A sample audiogram is provided below.
How to read an audiogram
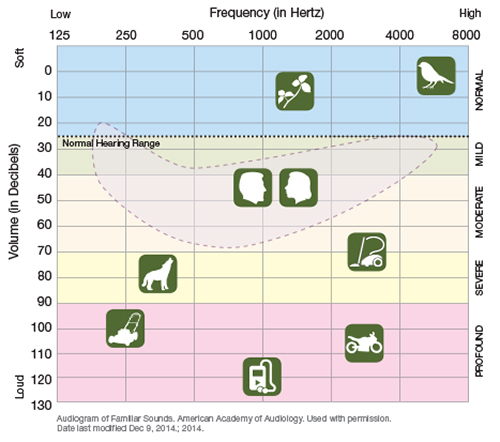
This sample audiogram can help you understand what your own audiogram shows about your hearing loss. On the sample:
-
Frequency (tone or pitch) is shown from left to right. As pictured above, a barking dog has a lower frequency than a vacuum cleaner.
-
Volume is shown from top to bottom. A chirping bird (top of the graph) is much softer than a lawn mower (near the bottom).
-
Conversation sounds are shown inside the dotted line. Most vowel sounds are lower frequency and louder volume than most consonants.
-
Amount of hearing loss is shown in the labels on the right of the graph. Someone with mild hearing loss may only have trouble hearing birds or understanding conversation. A person with profound hearing loss may not even hear a bus go by.
© 2000-2024 The StayWell Company, LLC. All rights reserved. This information is not intended as a substitute for professional medical care. Always follow your healthcare professional's instructions.